Environmental Monitoring of Creek Based Shrimp Farms : A GIS
- A.Anand
Coastal Aquaculture in India, has developed greatly in the past two decades, fueled by the increasing export value of shrimp. Widely practiced in the maritime states of Andhra Pradesh, Tamil Nadu, West Bengal, Maharashtra and Kerala, semi-intensive shrimp farming has become the major sector in the aquaculture scenario. Along with the developments and the booming exports, came the allegations of alleged destruction of mangroves for the construction of farms, eutrophication of coastal waster bodies, subsidence of land with the usage of ground water, salinization of agricultural lands. Concerned over these developments and with the past experiences of the southeast Asian shrimp farming countries, environmental groups have called for a complete ban on the shrimp farming other than by traditional methods. These activities culminated with the Hon'ble Supreme court of India ordering the closure of shrimp farming activities other than by traditional methods in the Coastal Regulation Zone (C.R.Z.).
Most of these concerns are however speculative in nature and not adequately supported by scientific evidence. Although these cannot be completely ruled out, it is however imperative that the industry survives and a balance is struck between the costs and benefits. This situation can be eased to a large extent by continuous monitoring of the farming activities in terms of effect on the environment and the socioeconomic fabric of the surrounding fishing villages. Developing an extensive database can help monitoring the area. Geographic information Systems are one of the most advanced tools which can adequately help monitor and further planning the development of the area. They combine the advantages of mapping with database to produce a spatial management system of the various features.
The present project is conceived with the objective of preparing a model GIS for the environmental monitoring of a creek based semi-intensive shrimp farming region.
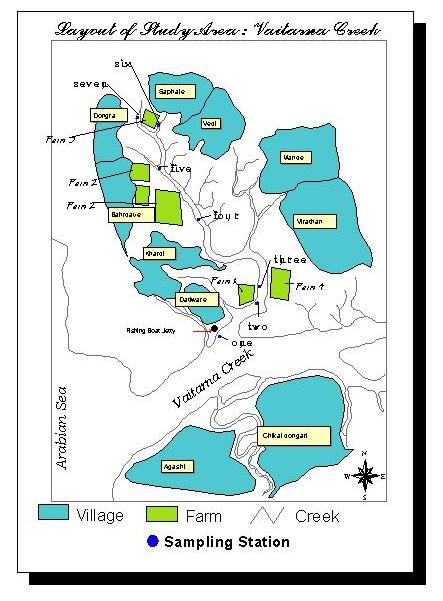
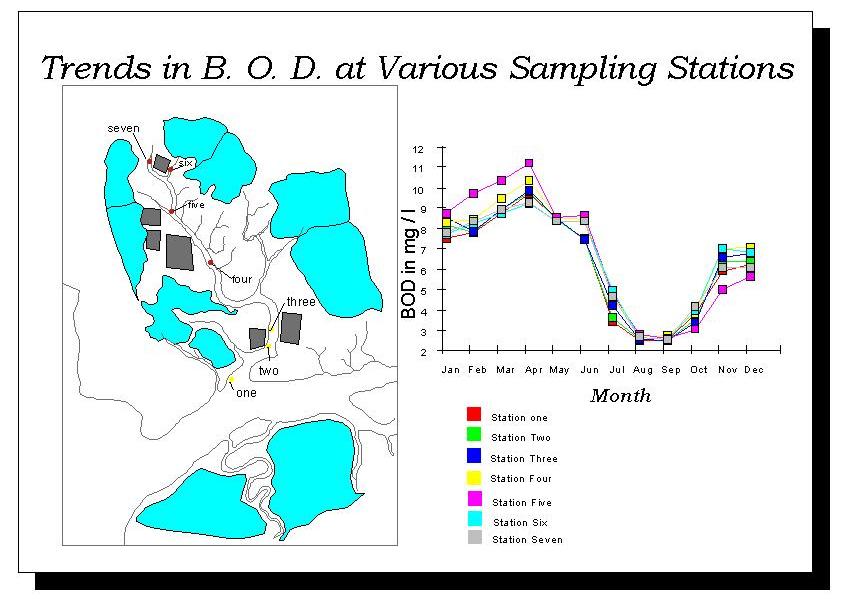
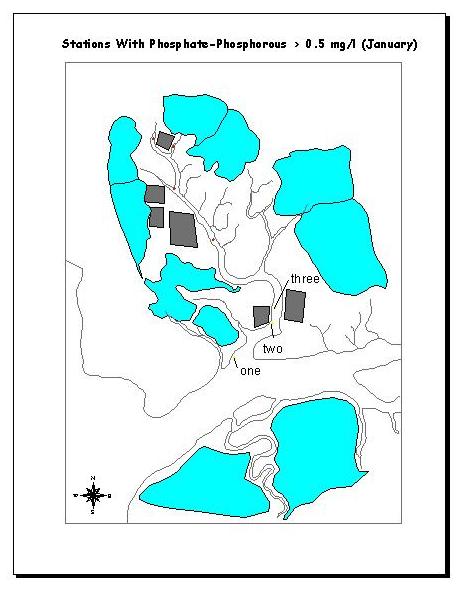
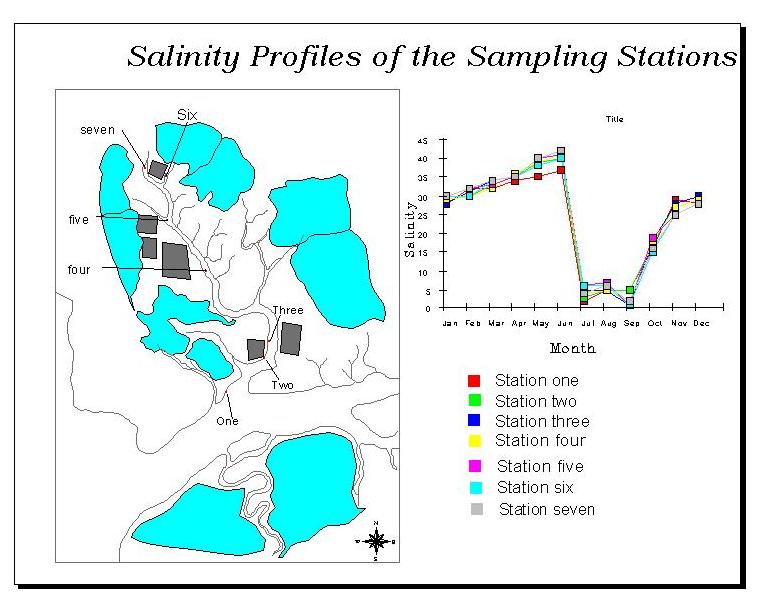
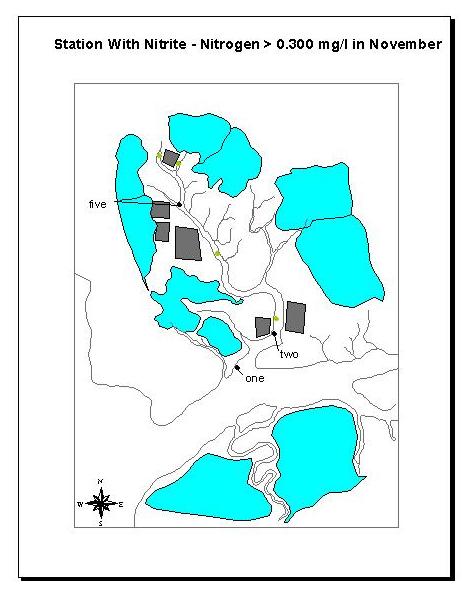
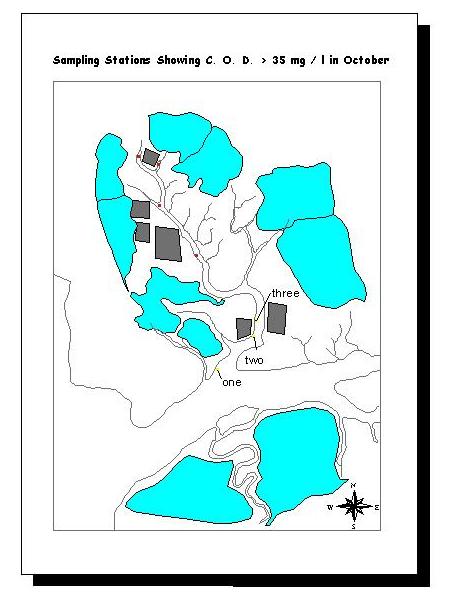
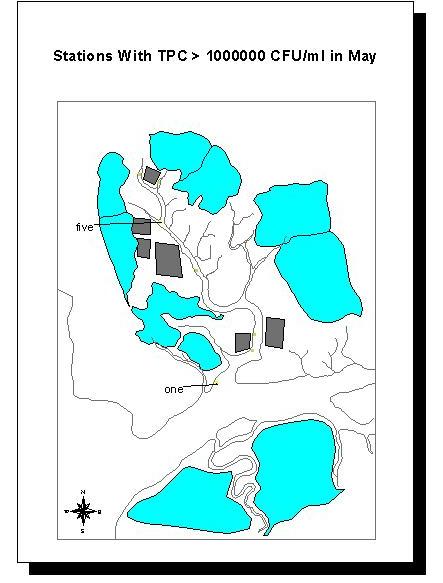
The Vaitarna creek including the Saphale region comes under the Palghar taluka in Thane district. The study area included parts of the vaitarna creek which are used as the inlet source and outlets of the four major shrimp farms which lie along the creek. The farms were numbered Farm one, Farm two, Farm three and Farm four respectively. Seven stations for collection of samples included Station one located at the mouth of the creek near the boat jetty, Station two and three along the inlet and outlet points of farm one, Stations four and five along the inlet and outlet points of farm two and Stations six and seven along the inlet and outlet of farm three. Parameters of the water sample studied were, Salinity, Biochemical oxygen demand, Chemical oxygen demand, Total plate count, Nitrite -nitrogen and Phosphate.
The map of the study area was scanned and the raster image was digitised
with AutoCAD. The AutoCAD dwg file was exported to pc-Arcinfo in dxf format. The
dxf image was processed with Arcinfo (ver 3.5.2) , cleaned and built. The list
of coverages is given in the following table.
The
coverages were then joined with their corresponding database files (dbf
version). The coverages with the date were then assembled using Arcview (3.1).
The querying with respect to the parameters at the different station was done in
the views and the thematic maps assembled in the layouts.